How to build approximation line
Examples:
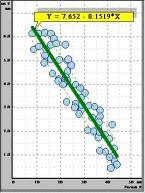
Regression line through a series of points
Follow these steps to build the regression line:
 |
- To select series of points in list, double
click on it.
- The dialog 'Information on points series' will appear.
- Click the button <Function...>
- The Wizard of approximation starts.
- On a step 1 we choose relation Y = f( X ).
- On a step 2 we choose 'Regression line'.
- On a step 3 we choose ''Polynomial'.
- On a step 4 we select polynomial degree 1.
- Recalculate.
- Put information string on the Clipboard.
- On a step 5 we select color and width of line.
- Regression line was build.
- Click button
 and paste information string.
|
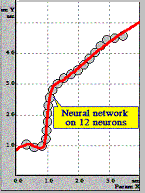
Using the neural network approximation
Follow these steps to use the neural network:
 |
- To select series of points in list, double
click on it.
- The dialog 'Information on points series' will appear.
- Click the button <Function...>.
- The Wizard of approximation starts.
- On a step 1 we choose relation Y = f( X ).
- On a step 2 we choose 'Neural network'.
- On a step 3 we choose 300 iterations.
- On a step 4 we select 20 neurons.
- Recalculate.
- If failed, we select 12 neurons.
- Recalculate.
- On a step 5 we select color and width of line.
- Approximation line was build.
|
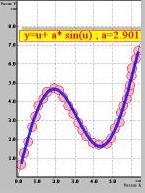
Using the non-linear fitting
Follow these steps to use the non-linear fitting:
 |
- To select series of points in list, double
click on it.
- The dialog 'Information on points series' will appear.
- Click the button <Function...>.
- The Wizard of approximation starts.
- On a step 1 we choose relation Y = f( X ).
- On a step 2 we choose 'Non-linear'.
- On a step 3 we input desirable formula
with parameter (a) Y( u ) = u + a*sin(u).
- Define initial values of the fitting parameters and click the button <Preview>.
- New graph will appear. See how fit curve conforms your data.
- On a step 4 recalculate. It may take a lot of time for slow computers.
- On a step 5 we select color and width of line.
- Approximation line was build.
|
Important: The expression must be composed from internal functions
(see formula for more
details), operators and only following parameters: a, b, c, d. The result
of your fitting session critically depends
on initial values of parameters.
Examples:
- Y( u ) = a + b*u^2.5 + c*u^4;
- Y( u ) = a + b/u + c * exp( u/10 );
- Y( u ) = 5+ a*besselj0( u );
- Y( u ) = 5+ a*normal( u, c);
Trick: View Log Fitting Window
to discover the best model to describe your data.
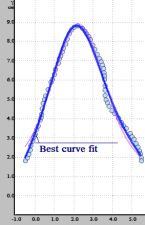
Best curve fit
Follow these steps to find the best curve fit:
 |
- To select series of points in list, click on it.
- select menu item <Fit><Best Function>
or click on button
 . .
- The Wizard starts.
- On a step 1 we choose X and Y ranges.
- On a step 2 we check groups of functions.
- On a step 3 we click on button Start.
Fitting process will run. It may take a lot of time for slow computers.
- New graphs will appear. See how fit curves conform your data.
- Select the number of best fit functions to plot. Only this functions will be saved.
- Several approximation lines were build.
|
B-spline through all points inside area
Follow these steps to build the B-spline:
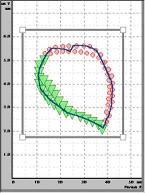 |
- Select
 and create area around points. and create area around points.
- Select editor mode

- Click left inside the rectangle area.
- The dialog 'Information on selected area' will appear.
- Click the button <Function...>
- The Wizard of approximation starts.
- On a step 1 we choose relation Y = f( X ).
- On a step 2 we choose 'B-spline'.
- On a step 4 we select the power and the number of control points of B-spline.
- On a step 5 we select color and width of line.
- Spline was build.
|
Sections through all red points inside selected area
Follow these steps to build the sections:
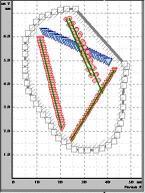 |
- Select
 and create area around points. and create area around points.
- Use
 to select area. to select area.
- Select the current color - red
- Click right button on area. Popup menu will appear.
- Select item <Function through red selected points>.
- The Wizard of approximation starts.
- On a step 1 we choose relation Y = f( X ).
- On a step 2 we choose 'Sections'.
- On a step 4 we select nodes of net 50.
- On a step 5 we select color and width of line.
- Sections were build.
|

á

 and paste information string.


